Historical graphs and logs
- Point your mouse at a bar to show the details for that day.
- Click a bar to get the full size graph for that day, and the complete daily log.
Annual graphs
2010 |
2011 |
2012 |
2013 |
2014 |
2015 |
2016 |
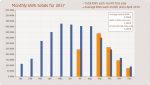
2017 |
2018 |
2019 |
2020 |
2021 |
2022 |
2023 |
2024 |
2025 |
2026 |
 |
 |
 |
 |
 |
 |
 |
 |
 |
 |
 |
 |
 |
 |
 |
 |
 |
Monthly totals and graphs for 2014
Month |
Total |
Average |
Highest |
Lowest |
Click a graph |
| December, 2014 | 89,439 | 3,194 | 10,152 | 162 |  |
| November, 2014 | 108,909 | 3,755 | 13,949 | 4 | 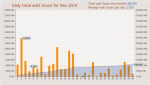 |
| October, 2014 | 224,169 | 7,472 | 15,913 | 1,250 |  |
| September, 2014 | 336,155 | 12,450 | 18,826 | 2,842 | 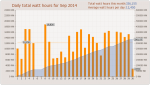 |
Month |
Total |
Average |
Highest |
Lowest |
Click a graph |
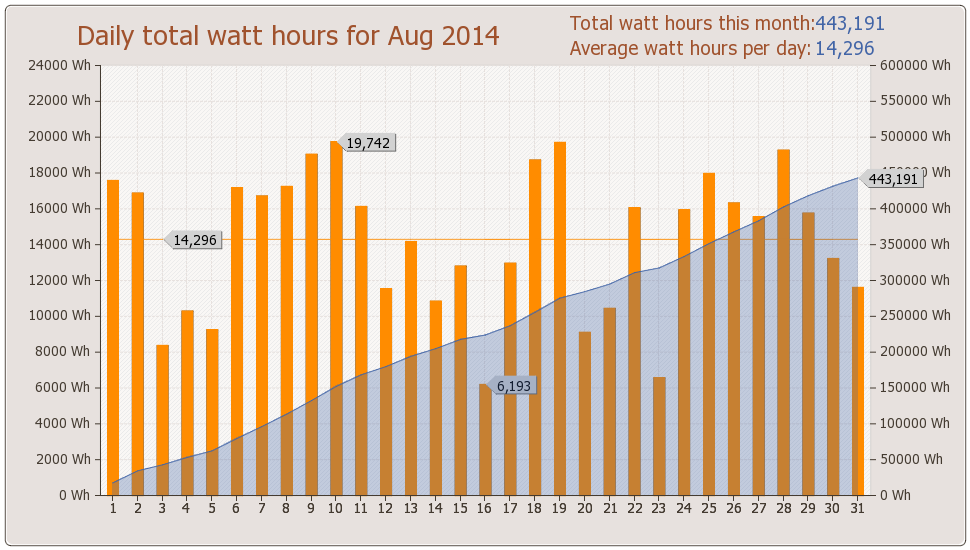
| August, 2014 | 443,191 | 14,296 | 19,742 | 6,193 |  |
| July, 2014 | 477,115 | 15,390 | 21,493 | 7,357 |  |
| June, 2014 | 445,298 | 16,492 | 21,885 | 7,965 |  |
| May, 2014 | 453,640 | 14,633 | 21,931 | 5,651 |  |
Month |
Total |
Average |
Highest |
Lowest |
Click a graph |
| April, 2014 | 380,720 | 12,690 | 21,774 | 273 |  |
| March, 2014 | 280,248 | 9,040 | 20,622 | 2 |  |
| February, 2014 | 174,789 | 6,722 | 17,989 | 68 |  |
| January, 2014 | 55,308 | 3,950 | 13,109 | 157 |  |