Historical Graphs and Logs

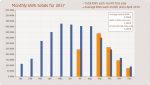
- Point your mouse at a bar to show the details for that month.
- Click a bar to get the full size graph for that month, where you can drill down to each day.
Annual graphs
2010 |
2011 |
2012 |
2013 |
2014 |
2015 |
2016 |
2017 |
2018 |
2019 |
2020 |
2021 |
2022 |
2023 |
2024 |
2025 |
2026 |
 |
 |
 |
 |
 |
 |
 |
 |
 |
 |
 |
 |
 |
 |
 |
 |
 |
Monthly totals and graphs for 2015
Month |
Total |
Average |
Highest |
Lowest |
Click a graph |
| December, 2015 | 64,289 | 2,795 | 9,531 | 565 |  |