Historical Graphs and Logs

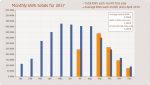
- Point your mouse at a bar to show the details for that month.
- Click a bar to get the full size graph for that month, where you can drill down to each day.
Annual graphs
2010 |
2011 |
2012 |
2013 |
2014 |
2015 |
2016 |
2017 |
2018 |
2019 |
2020 |
2021 |
2022 |
2023 |
2024 |
2025 |
2026 |
 |
 |
 |
 |
 |
 |
 |
 |
 |
 |
 |
 |
 |
 |
 |
 |
 |
Monthly totals and graphs for 2010
Month |
Total |
Average |
Highest |
Lowest |
Click a graph |
| December, 2010 | 105,432 | 3,401 | 10,501 | 118 |  |
| November, 2010 | 206,816 | 6,893 | 13,829 | 194 |  |
| October, 2010 | 270,691 | 8,731 | 16,433 | 1,906 |  |
| September, 2010 | 317,593 | 10,586 | 18,030 | 652 |  |
Month |
Total |
Average |
Highest |
Lowest |
Click a graph |
| August, 2010 | 451,233 | 14,555 | 19,802 | 3,131 |  |
| July, 2010 | 512,315 | 16,526 | 22,023 | 3,772 |  |
| June, 2010 | 432,465 | 14,415 | 22,281 | 2,240 |  |
| May, 2010 | 492,572 | 15,889 | 22,209 | 5,743 |  |
Month |
Total |
Average |
Highest |
Lowest |
Click a graph |
| April, 2010 | 476,604 | 15,886 | 22,356 | 1,889 |  |
| March, 2010 | 112,989 | 14,123 | 20,556 | 5,105 |  |


